

Ratul Hora #7
As time and data collection proceeds, I guess I need to look into examples for the design project as well. Found サスティナビリティの意匠的検討に基づく集合住宅設計 by 山田匠。I contains most of the sustainable design projects presented in the SD review magazine. He divided them into the following:
a. Form
b. Material
c. Facade
d. Plan/Placement
e. Cross Section
Examples of Form
Example 1: 鈴木設備事務所社屋
Example 2: 地球環境戦略研究機関 新建築
Example 3: スリーザスクエア (見つからない)
Example 4: 角田歯科医院
Example 5: 三ヶ日町立図書館
Example 6: 川尻小学校
Example 7: ところミュージアム大三島
Example 8: 月見の里学遊館
Example 9: アーバネックス三条
Example 10: なおび幼稚園
Ratul Hora #6
- Getting Station IDs with their online links first.
- Tried to access the API by wundergrounf and by NETATMO, but both provide current info and not historic data. Copy paste might be the only option here.
- Overall the first step is to get “Hyper Local” Temperature data.
- Then create 東京23区温度分布図of the following types:
- Max Temp average
- Temperature gradient on the hottest day of the year
https://dev.netatmo.com/resources/technical/introduction Link to netatmo api— doesnt work
wunderground map – link to past data, will collect this
1. After gather average max temp b/w 6月 and 9月 of last year, pick the hottest and coolest areas from the list and work inwards
Why max temp represents the hottest hour, ergo the the ttime of the day when the max amount of heat energy is stored within the buildings, hence radiating max energy hence having max temp.
2. Check for the hottest day in the past year in tokyo and set that as the simulation setting
3. Create 560m (approx 1km2) radius models of each of those areas, working inwards simulate.
4. NEEDs to be circular
5. Analysis will depend on comparing
CEP – HIP – PHF – DID/Volume
6. try and prove that even when wind is taken intoaccount you need to build high density tall areas in order to reduce HIP and PHF. The only reason that high dense environments have been shown to not be good for heat island are because (菅沼)the heat has a hard time escaping.

Why circular? how does it help to have a cicular model instead of square??

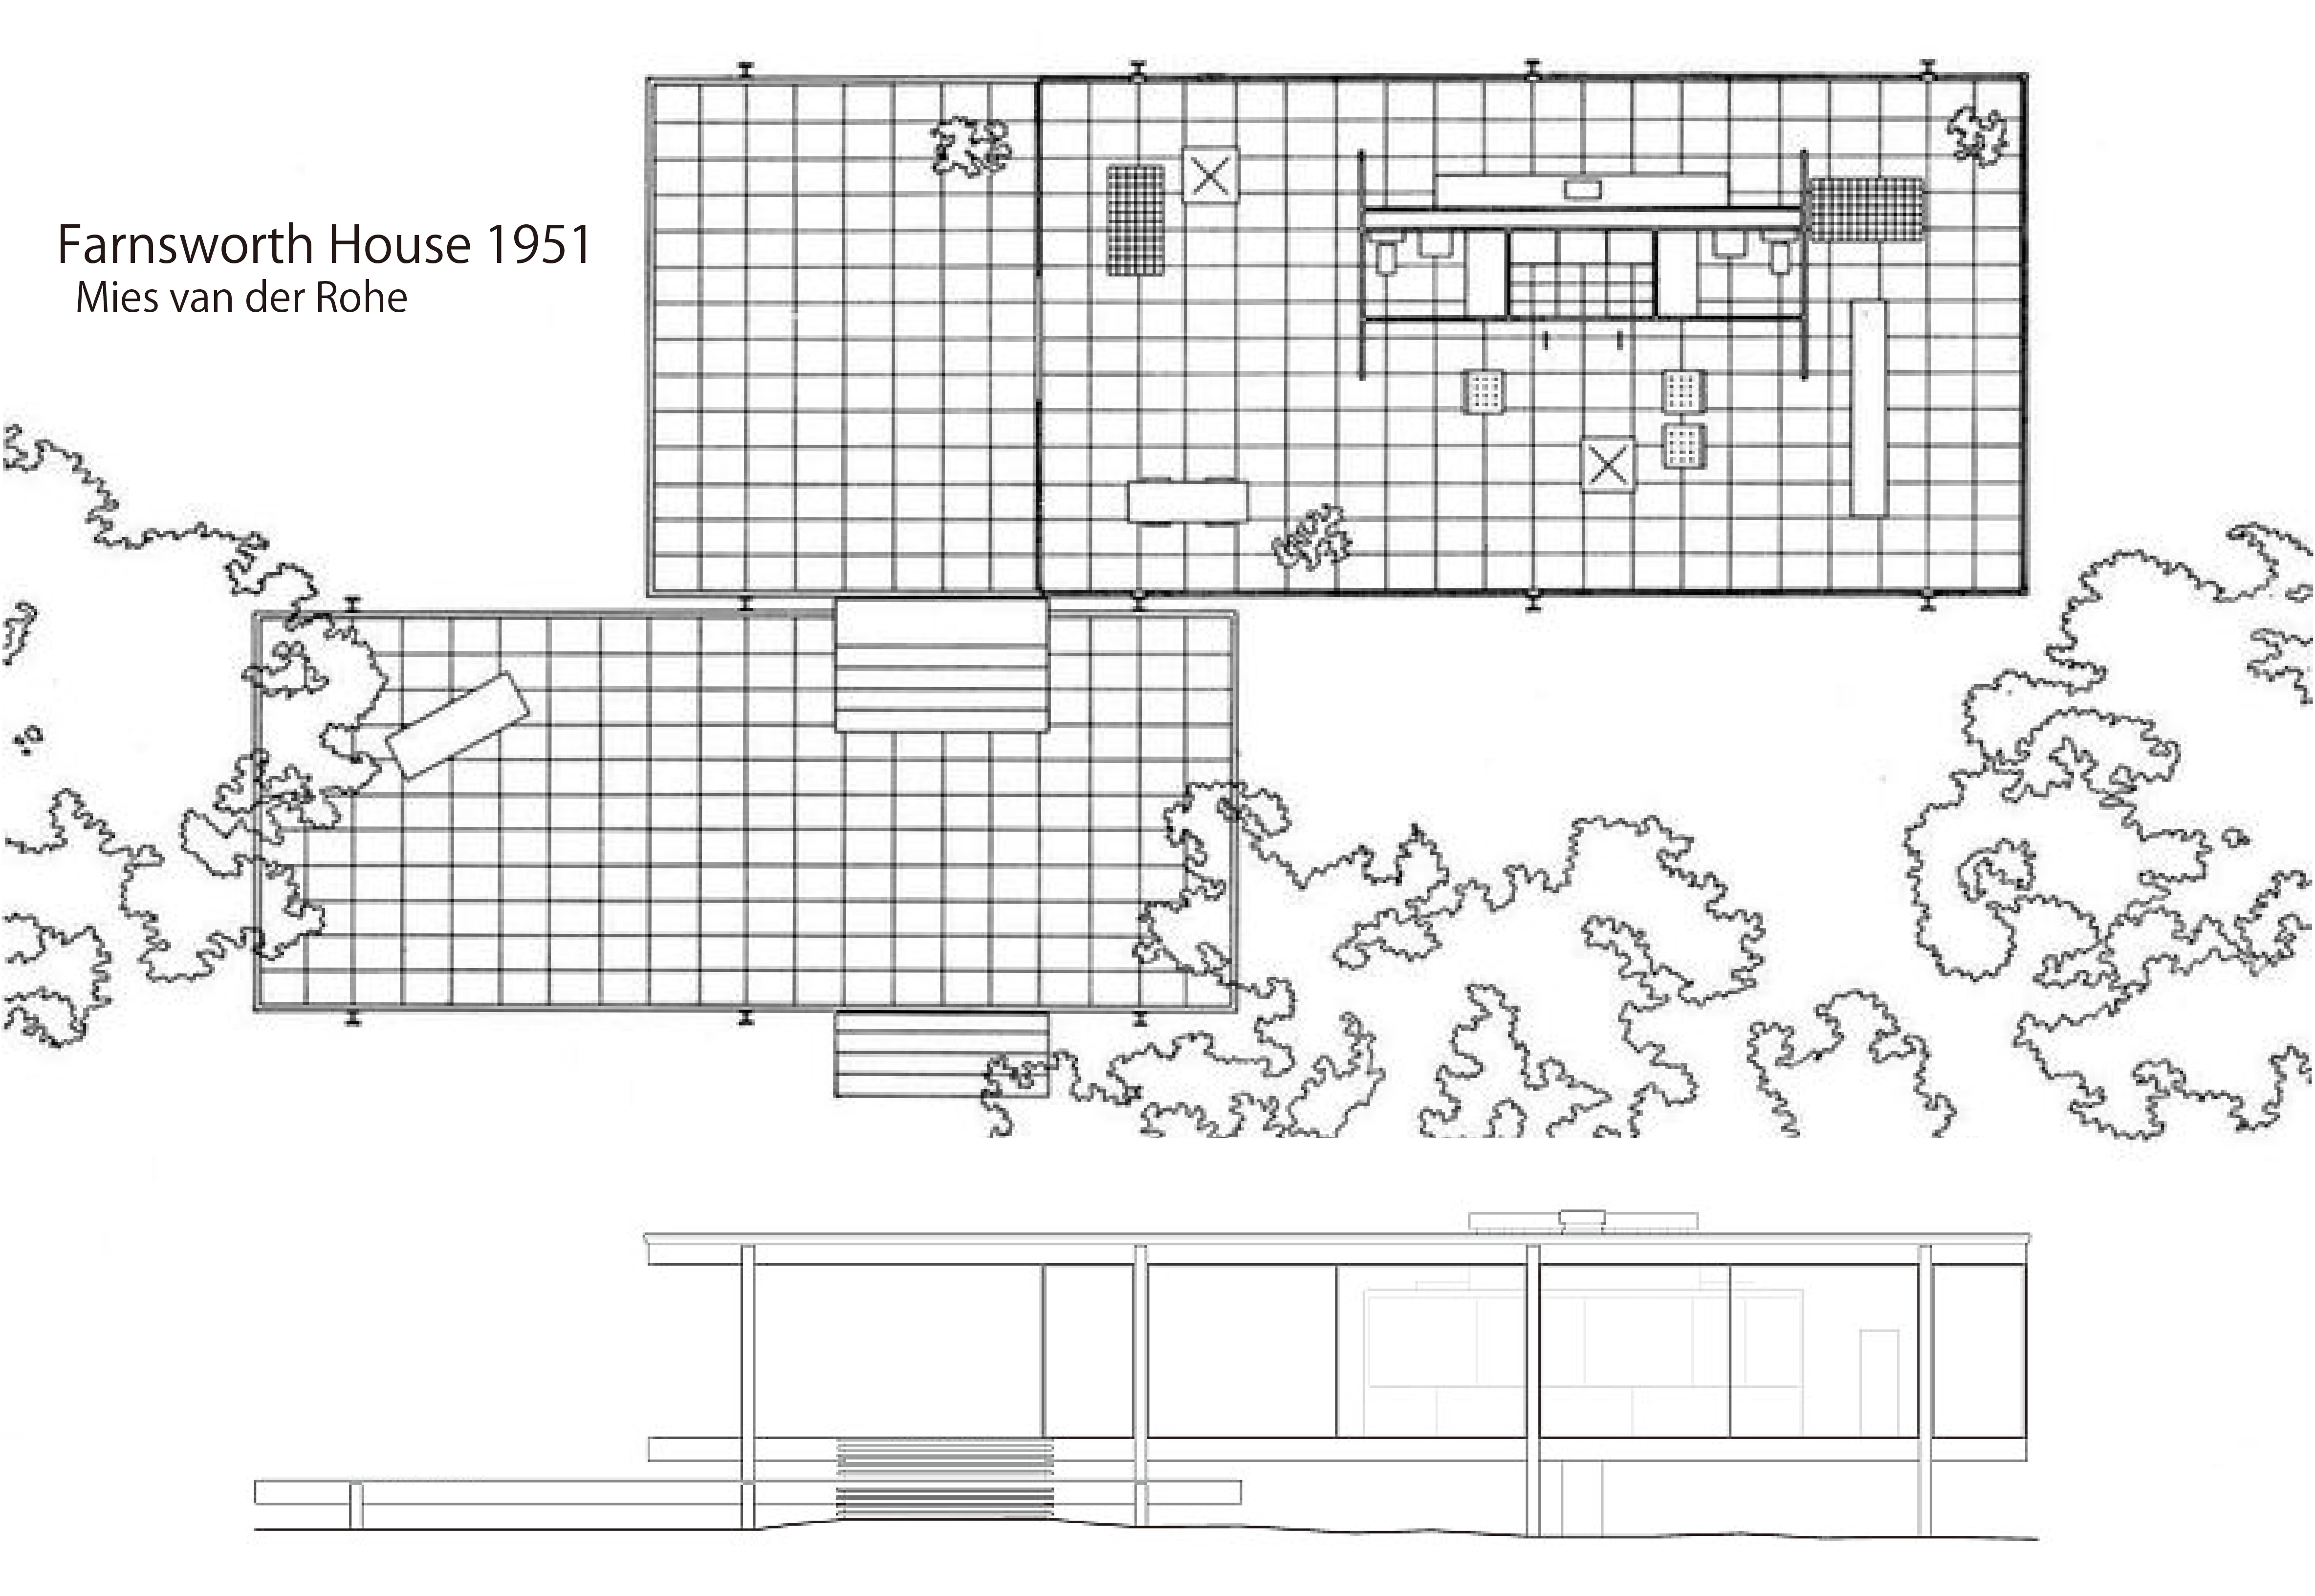
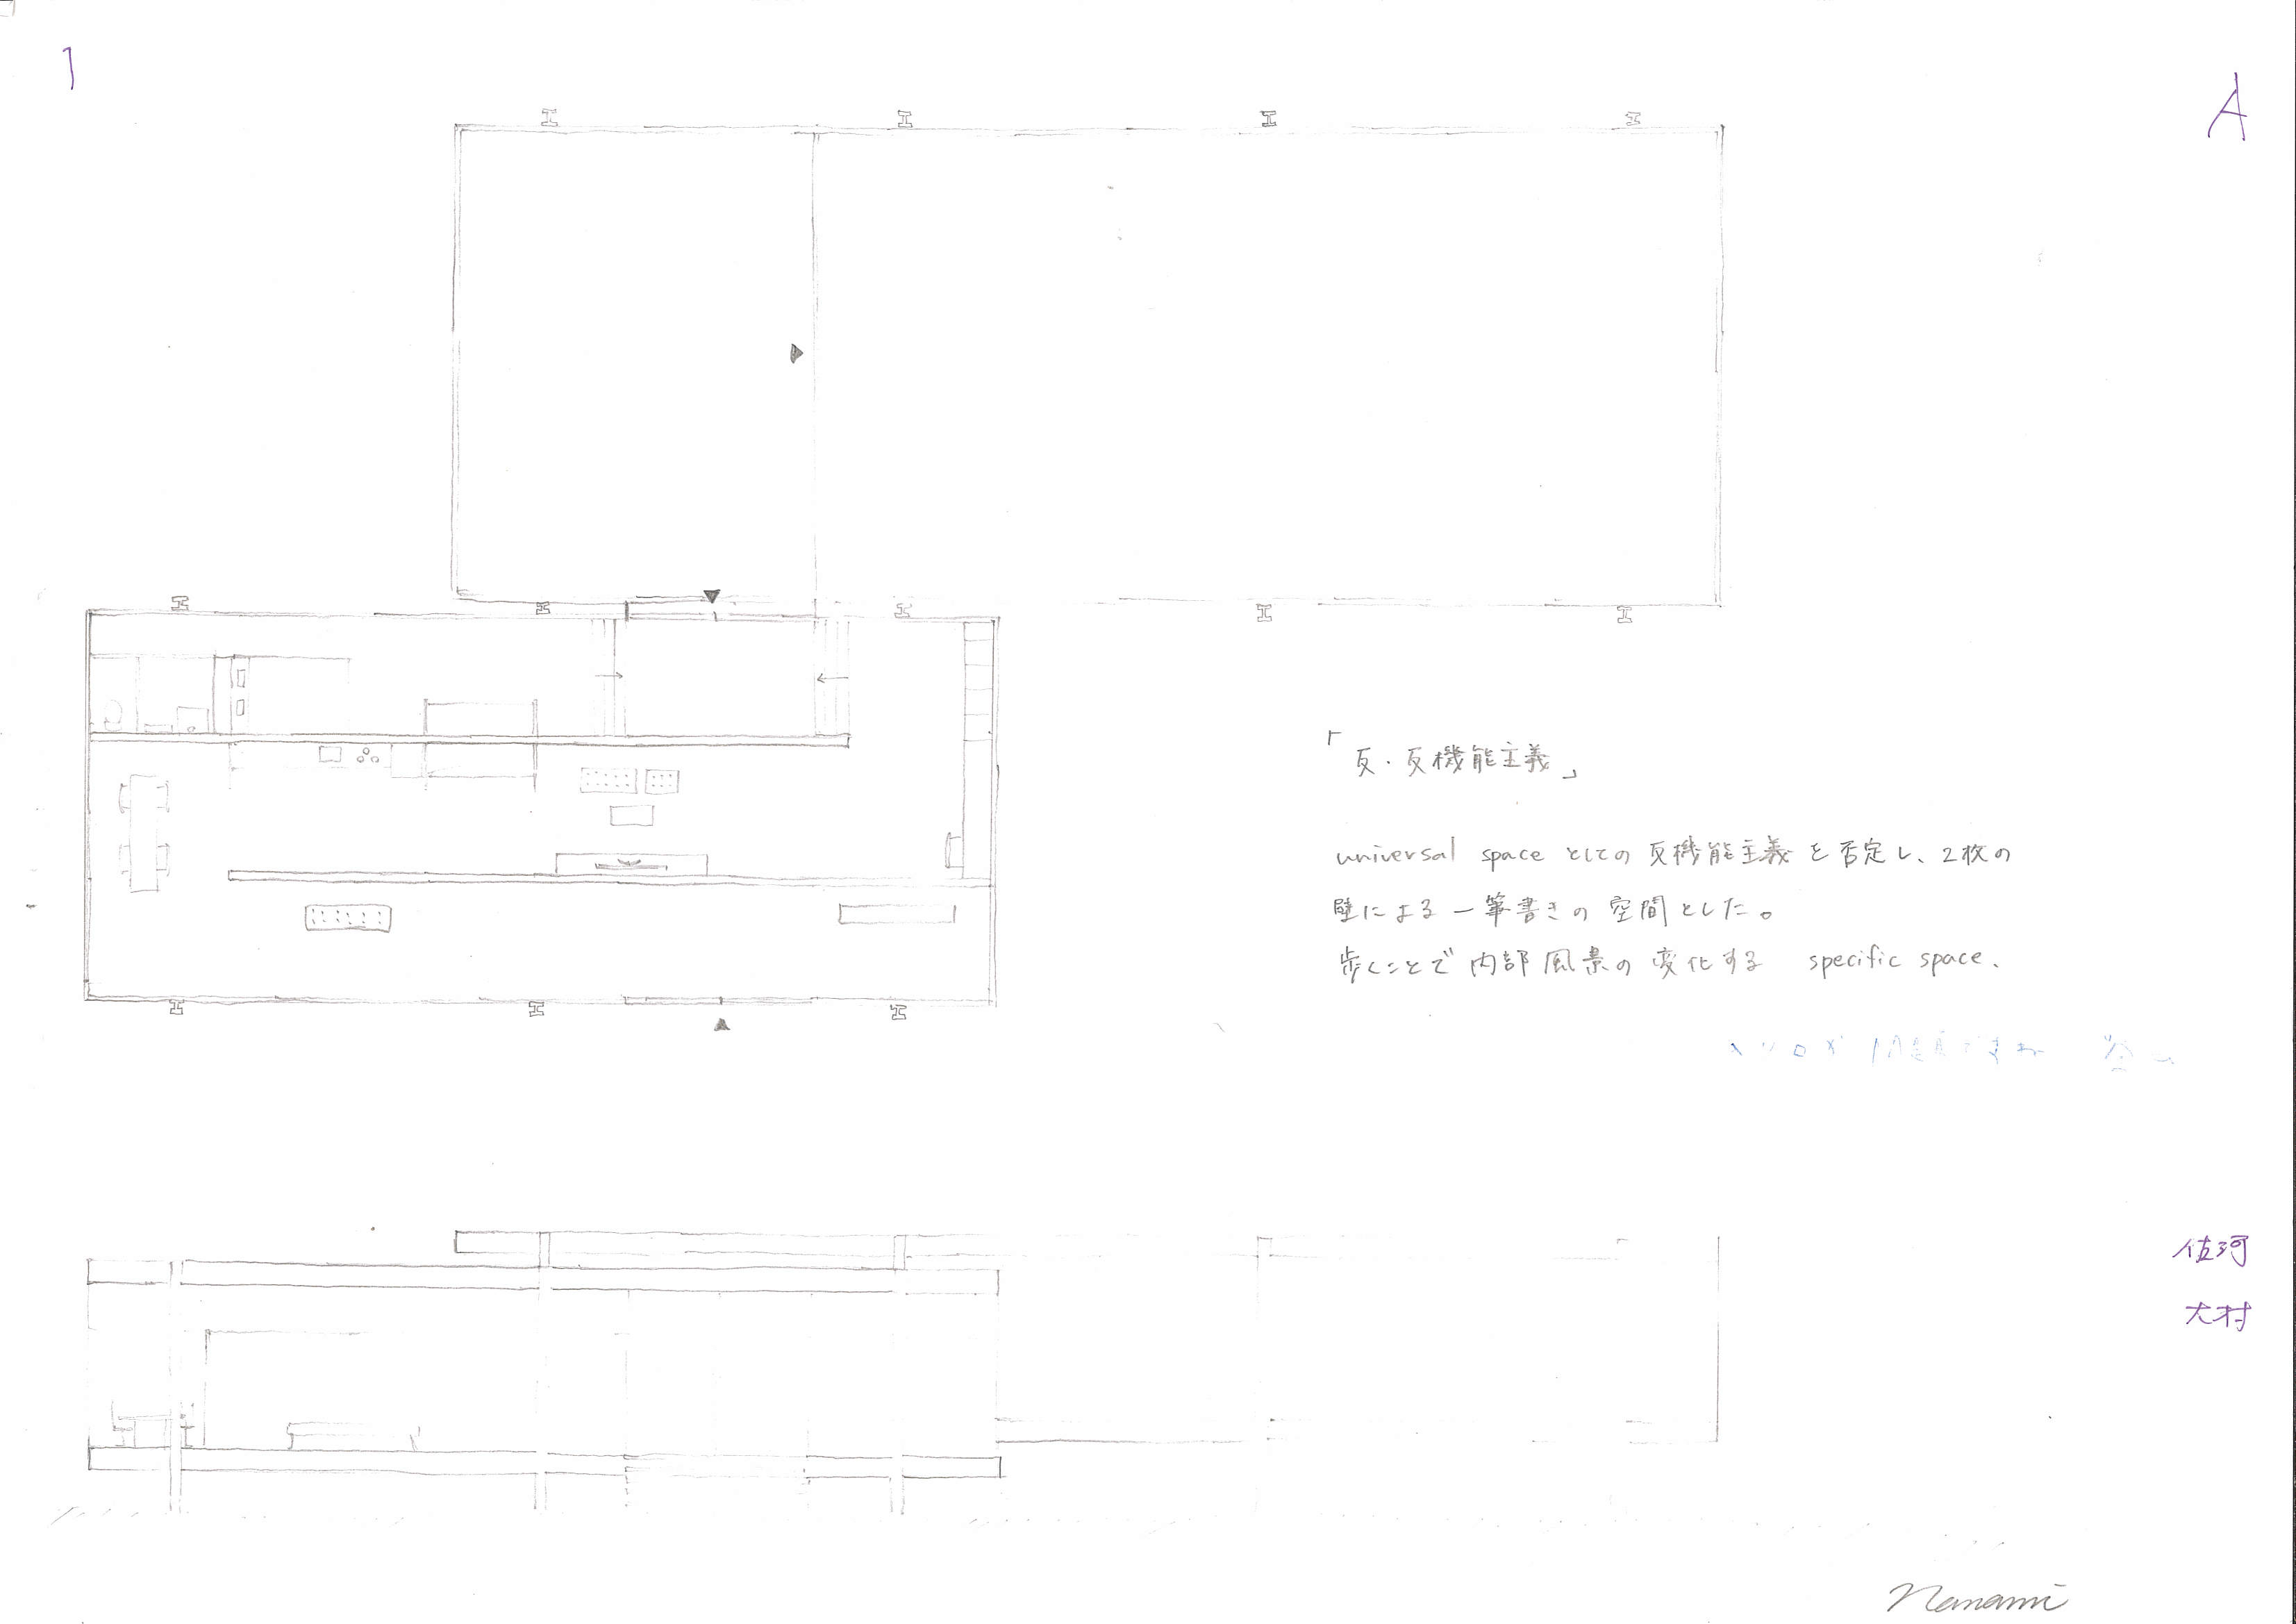
第1回一時間設計(後期)9/22
【ミースファンデルローエ / ファンズワース邸(1951)】
ーお題ー
1.図面左下の室が無い部分に「機能主義建築」を設計する。
2.既存の建築の空間性を壊さないようにする。

Ratul Hora #5
(Res3)東京周辺におけるヒートアイランドの現状と土地利用との関連性に関する研究
This thesis used weather information from two sources. アメダス(by the Japan Metereological Agency) and Weather Underground (www.wunderground.com) by an American agency. Problem with アメダス is that it doesn’t have enough locations with data, even within the 23 wards of Tokyo it has about 21 stations. Weather Underground on the other hand seems to have a lot more locations currently, maybe because of the increase of stations bought after this particular thesis was done
Weather Underground and Tokyo Hot spots
For tomorrow, take all the weather spots in the 23区area and put them in an excel sheet. Collect the following information:
- Location of the station
- ID of the station
Giddy発表
Too huge, but the analytical space is limited to only 300m around the weather station
Cant really deal with heights and form of the city block. As shown before, in (res1) almost all countermeasures refer to change in surface material. But these measures are fairly impractical. We need a countermeasure that can be implemented through FORM.
行谷卒論
Too specific to location, deals purely with changing or improving material
Such studies become too location specific, but try and employ countermeasures that are at the scale of remote sensing?? Why?
Need 東京温度分布, will make one based on netatmo data. And pick the top 20 locations
Ratul Hora #4
(Res1)5 cases were simulated over Tokyo, 1. 緑化 2.保水材 3.高反射材 4.道路交通排熱削減 5.建物排熱削減 from 2015 to 2030:
After which the max cases of 1 and 4+5 were carried out which shows the following results
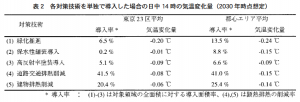
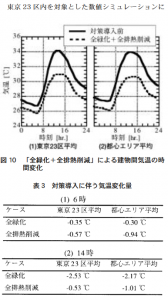
The Tokyo area’s 気温has increased over 3°C, looking at the results of 全緑化 of -2.53°C shows that it can basically solve the entire Heat island issue. But that is not what we are here to do. We can’t return an urban area back to a completely “green” area. The city with its concrete etc has other factors that affect our lifestyle. Wind was most probably not simulated because of the large scale and impracticality of the simulation. But these countermeasures are not exactly passive methods (except for green cover) each of them have hidden implementation and management costs. Furthermore, the percentage of area that can be covered using said measures is extremely low, the impact as well is low.
Is it necessary to consider heat island from a city scale perspective? Research(Res2) suggests that UHI effect may contribute to just 2%-4% of gross global warming (Which does not include emissions due to energy consumption). Even if emissions are considered, a lot of the above stated measures do not “directly” deal with reducing energy consumption and release of greenhouse gases per say. The only viable option is to deal with both areas systematically is to first look at the problem of UHI from a “city block” scale. Bringing back design to the equation instead of large scale countermeasures which are trying to tackle something that is developed by small scale development of a landscape.